1. What it is
A Business Capability Model (BCM) defines what the organisation must be able to do to deliver its purpose.
It is:
- independent of organisational structure, processes, or systems,
- stable over time, even as implementation changes,
- a structured view of the organisation’s abilities.
A capability describes:
- what the business does (not abstracted into slogans),
- defined by shared meaning and use across the organisation,
- connected at Level 3 to entities, activities, and KPIs, where work, data, and measurement converge,
- owned through lifecycle responsibility, not organisational structure or wording conventions,
- the basis for data ownership and accountability,
- at Level 1, expressed through the capability’s mission, capturing the organisation’s core responsibilities.
Why it matters
Most organisations struggle not because they lack activity — but because they lack coherent structure.
Symptoms show up as:
- Duplicated or overlapping functions.
- Unclear ownership of outcomes.
- Fragmented systems aligned to silos.
- Strategy disconnected from execution.
- Unclear ownership and responsibility for data.
- Lack of a coherent and cohesive cross-business perspective.
Without a capability model:
👉 The organisation cannot clearly see what it must be able to do.
2. BCM Overlays — The tool for business perspectives.
Overlays provide a cross-organisational perspective by applying a specific lens to the same capability model.
In our following examples, we provide overlays in three different useful contexts for each example:
- Strategy & Value
- Risk & Compliance
- Data & Meaning
Overlays are typically visualised using simple colour coding (e.g. High, Medium, Low) to provide a mind-sized view across the organisation.
The intention is to provide a mindsized view across the whole organisation.
An example from Adapt, Survive and Flourish:
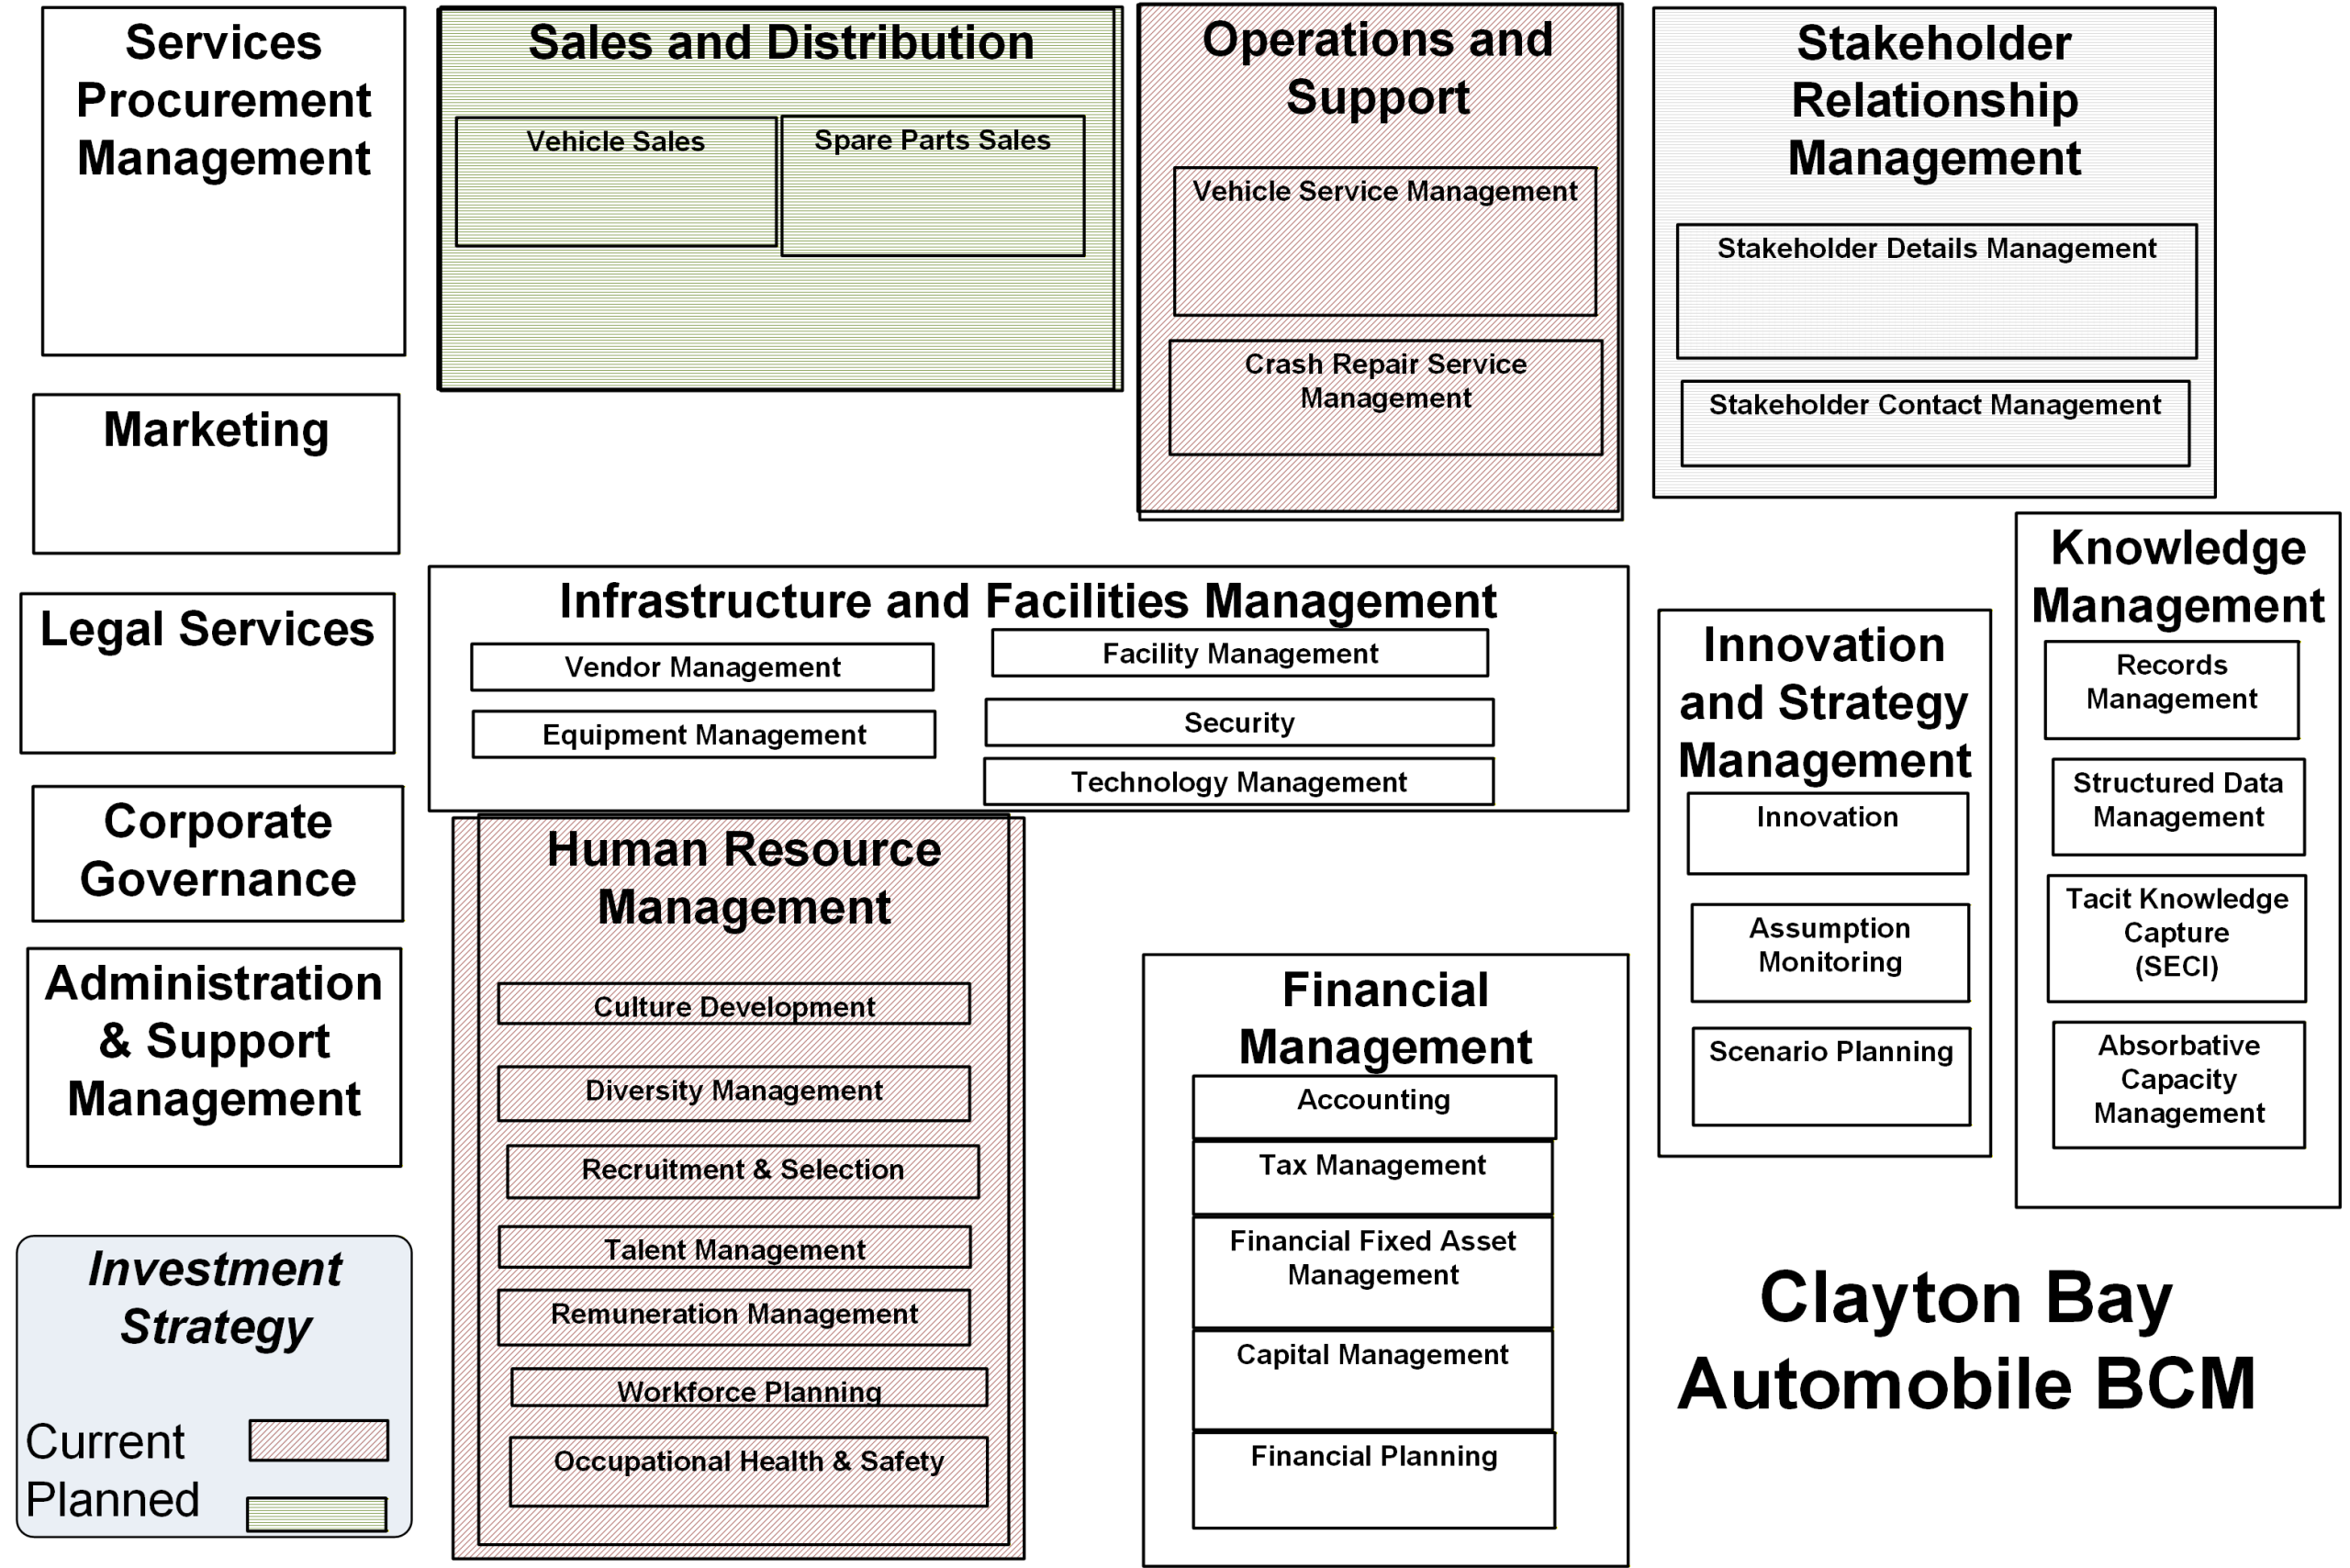
Figure 1: Simple BCM Overlay for a small service business.
🛒 Retail Business (e.g. lawnmowers / consumer goods)
Overlay 1 — Strategy & Value
Overlay:
Mapping each capability against its strategic importance and contribution to value creation.
Typical capabilities highlighted:
- Product Management → HIGH
- Customer Management → HIGH
- Supply Chain → MEDIUM.
👉 Insight:
- Growth driven by product range and customer reach.
- Supply chain is enabling, not differentiating.
Overlay 2 — Risk & Compliance
Overlay:
Mapping each capability against its risk exposure and compliance obligations.
Capabilities highlighted:
- Product Compliance → HIGH
- Supplier Management → MEDIUM
👉 Insight:
- Risk is concentrated in product safety and supplier quality.
- A failure here → recalls, brand damage
Overlay 3 — Data & Meaning
Overlay:
Mapping each capability against the risks, integrity, consistency, and clarity of its underlying data and definitions.
Capabilities highlighted:
- Product Definition → HIGH risk
- Customer Records → MEDIUM
👉 Insight:
If “Product” is inconsistently defined across systems, then this leads to:
- Incorrect orders with rework from returns at both ends of the supply chain.
- Reporting errors.
- Chaotic production planning.
→ To name a few!
🏥 Hospital Overlays (public or private health system)
Overlay 1 — Strategy & Value
Capabilities highlighted:
- Patient Care Delivery → HIGH
- Clinical Decision Support → HIGH
- Administration → LOW
👉 Insight:
- Value = patient outcomes
- Admin supports but does not differentiate.
Overlay 2 — Risk & Compliance
Capabilities highlighted:
- Medication Management → VERY HIGH
- Patient Records → VERY HIGH
👉 Insight:
- Errors here = direct patient harm
- Risk is immediate and non-negotiable.
Overlay 3 — Data & Meaning
Capabilities highlighted:
- Patient Identity → CRITICAL
- Treatment Records → HIGH
👉 Insight:
- If “patient” is duplicated or misidentified:
- wrong treatment
- wrong medication
- legal exposure
👉 This is Conceptual–Physical Drift with real consequences
🏦 Bank Overlays (retail or commercial)
Overlay 1 — Strategy & Value
Capabilities highlighted:
- Customer Lending → HIGH
- Risk Assessment → HIGH
- Digital Channels → HIGH
👉 Insight:
- Competitive advantage = lending + digital experience
Overlay 2 — Risk & Compliance
Capabilities highlighted:
- Credit Risk Management → VERY HIGH
- Regulatory Reporting → VERY HIGH
👉 Insight:
- Failure here = capital loss + regulatory breach
Overlay 3 — Data & Meaning
Capabilities highlighted:
- Customer Identity → CRITICAL
- Exposure Calculation → CRITICAL
👉 Insight:
If “customer exposure” is defined differently across systems:
- Risk is understated.
- Capital allocation is wrong.
- Regulatory breach occurs.
What this demonstrates
Across all three:
Same overlays → completely different consequences
| Overlay | Retail | Hospital | Bank |
| Strategy | Product & customer | Patient care | Lending & digital |
| Risk | Product safety | Patient harm | Financial/regulatory |
| Data | Product definition | Patient identity | Exposure definition |
The structure is the same.
The consequences are context-specific.
The same capability model can reveal completely different risks and opportunities—depending on the lens applied.
3. How the BCM is structured.
A BCM structures the organisation into a hierarchy of capabilities:
- Level 1 (L1) — broad domains (e.g. Customer Management, Finance Management).
- Level 2 (L2) — meaningful groupings of work.
- Level 3 (L3) — where work, data, and measurement converge.
Capabilities are:
- defined, not assumed,
- bounded, not overlapping,
- and negotiated across domains.
The key principle
Capabilities describe the “what”, not the “how”.
This ensures:
- stability,
- reusability,
- independence from changing systems and processes.
The L3 Convergence Principle
At L3, three things come together:
👉 Entity Ownership + Activity Set + KPI Cluster
Each L3 capability:
- owns the lifecycle of key business entities,
- performs a defined set of activities,
- and is measured through aligned KPIs.
This is where:
- BCM (what is done).
- Common Data Model CDM (what is known).
- Data Quality Management DQM (what is correct).
- Activity-Based Costing ABC (what is budgeted and what it actually costs).
👉 become a single coherent system
The pattern
Capabilities follow a natural pattern:
- Define → Manage → Control → Analyse.
- or
- Create → Maintain → Use → Review!
These patterns are not imposed—they emerge from the work itself.
4. What it reveals
A BCM exposes structural truths that are often hidden:
Capability gaps
What the organisation must do—but cannot yet do → defines transformation priorities.
Overlap and duplication
Multiple areas performing similar work → drives inefficiency and conflict.
Ownership clarity
Who is accountable for outcomes → determines effectiveness and trust?
Dependency structure
How capabilities rely on each other → reveals hidden complexity and risk.
These are not modelling artefacts.
They are organisational realities.
5. Relationship to Data Modelling and Ethics
- Data Modelling defines how the organisation understands its world.
- BCM defines what the organisation must do in that world.
- Ethics defines the consequences of how it acts.
At L3:
👉 these converge.
- capabilities act on entities.
- entities are defined in the data model.
- decisions create consequences.
You cannot separate them.
6. How to apply
🧰 From the AI/Human Business Modelling Guideline
This is a summarised extract only. See the full guideline for details. To create an initial strawman using AI, the guideline is uploaded to ‘program’ the query.
Step 1 — Start with business objects.
Customer, Product, Agreement, Asset
Step 2 — Apply “Management”
Customer Management, Product Management
Step 3 — Structure into L1 / L2
Group into meaningful domains.
Step 4 — Define clearly.
“The ability to…”
Step 5 — Socialise – absolutely crucial!
Build with the people who do the work → this is a SECI process.
Step 6 — Link to data (CDM)
Identify:
- entities
- ownership
- relationships
Step 7 — Test at Gemba
Validate against real work, decisions, and outcomes.
7. Where it fits
Executive Pathway
- aligning strategy to execution
- breaking down silos through shared structure
- prioritising investment and change
Practitioner Pathway
- defining capabilities and ownership
- linking data, process, and systems
- supporting integration and DQM
Transformation Pathway
- identifying gaps and dependencies
- structuring change initiatives
- aligning systems to business reality
Sustainable Transformation Pathway
- ensuring capability coherence over time
- aligning structure with purpose and ethics
- supporting long-term adaptability
⚓Closing line
A Business Capability Model is not just a diagram.
It is a structured understanding of what the organisation must be able to do — and the foundation for aligning strategy, execution, and change.