1. What it is
Data modelling is more than drawing pictures that represent data.
It is built through structured negotiation of shared meaning across an organisation.
It is a conceptual representation of the organisation’s shared understanding of its world:
- what things are,
- how they are interrelated,
- what matters about them,
- what does not,
- and how the results of its work are captured.
2. Why it matters.
Most organisations struggle not because they lack data—but because they lack a shared meaning of their data.
Symptoms show up as:
- Inconsistent definitions (“customer”, “product”, “risk”), leading to confusion, siloed thinking, and a culture of isolation.
- Fragmented systems capturing multiple versions of the same thing, each with its own interpretation.
- Integration complexity, where systems cannot “talk” to each other, so consistency is maintained manually — or ignored.
- Poor data quality, driven by unclear ownership and competing versions of the truth.
- Decisions based on competing interpretations, where the integrity of the decision is only as strong as the data behind it.
A well-constructed data model:
- creates a common language.
- aligns perspectives across domains.
- exposes hidden assumptions.
- connects people, systems, and decisions.
If meaning isn’t shared, nothing integrates.
3. How it works (in practice)
At its core, data modelling is storytelling made explicit and validated in business reality.
Here is a simple example.
Rob has a business selling lawnmowers. One day, Jenny rings and places an order for a Victa Model 350 Electric. Here is the data model of that order.
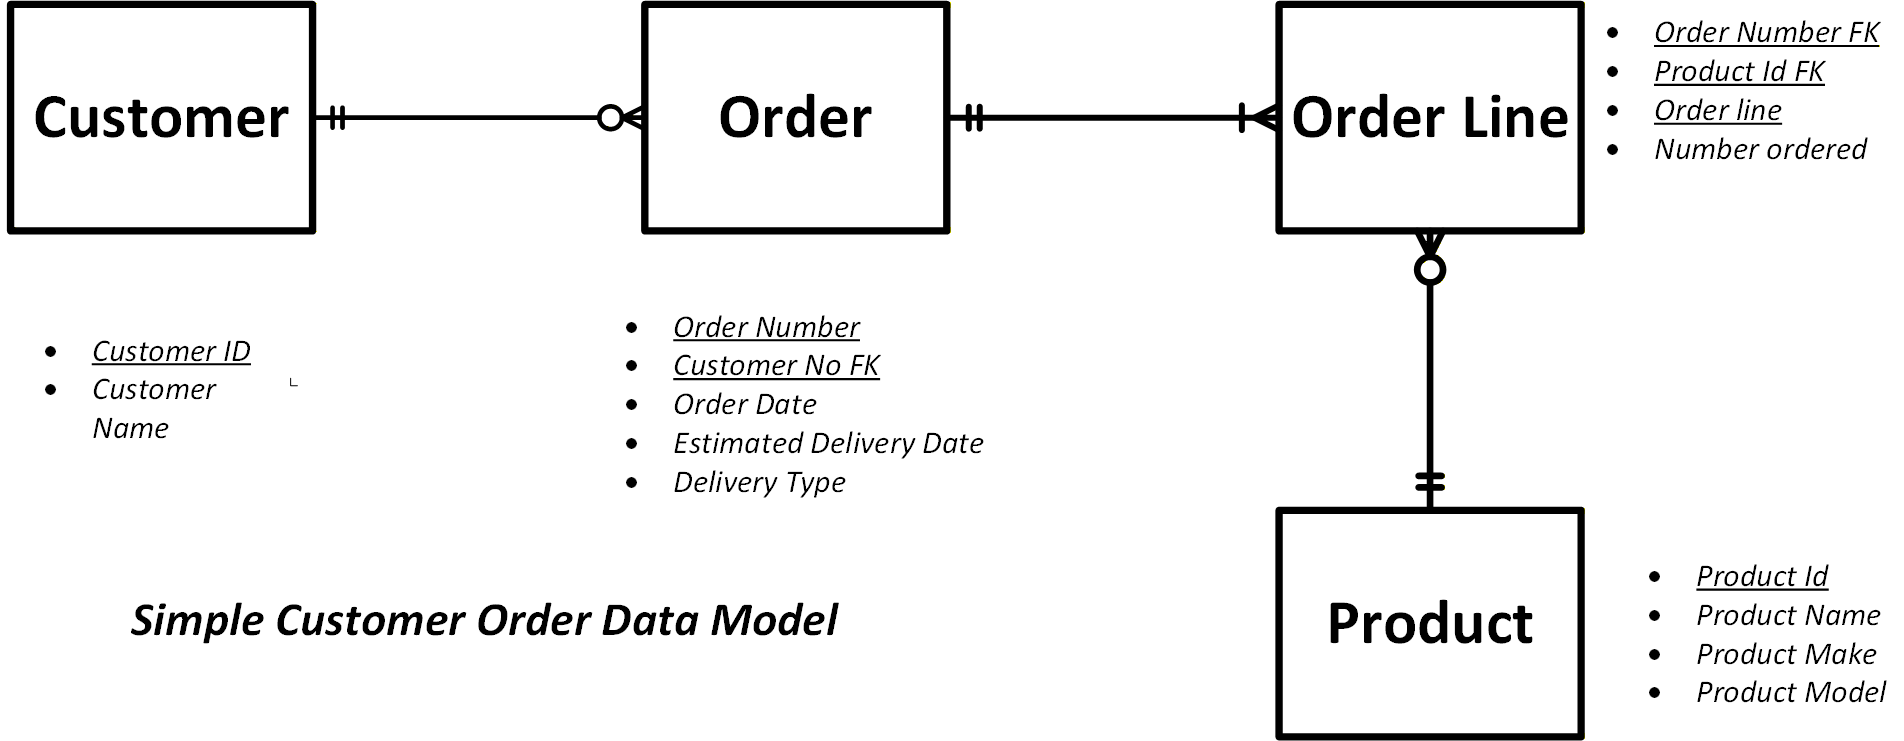
Figure 1: A simple conceptual data model of an Order.
Jenny’s order is an instance of this model in action. On Rob’s system, the actual order is recorded in a physical file structure.
| File | Attribute | Value |
| Customer | Customer ID | 9875 |
| Customer Name | Jenny | |
| Order | Order | A456 |
| Customer ID FK | 9875 | |
| Order Date | 2 April 2026 | |
| Estimated Delivery Date | 10 May 2026 | |
| Delivery Type | Pickup | |
| Order Line | Order Number FK | A456 |
| Product ID FK | 7658 | |
| Number Ordered | 1 | |
| Product | Product ID | 7658 |
| Product Name | Victa 350 | |
| Product Name | Victa | |
| Product Model | 350 Electric |
Notes:
IDs are unique for an instance of the Entity.
FK is an inherited Foreign Key. Here, the Order Customer ID is inherited from Customer. Inheritance is possible because of the relationship to Customer.
There is obviously much more detail possible, such as payments, invoicing, etc., and these are captured as the model is expanded as those stories emerge.
So, in the context of retail ordering, this is the ordering story.
A data model exists at two levels:
- Conceptual — the organisation’s shared understanding of its world
- Physical — how that understanding is realised in systems and data.
The critical question is alignment. If alignment is lost, the organisation fragments.
When the physical model drifts from the conceptual, the system no longer reflects reality — and the consequences show up in operations, decisions, and outcomes.
Each domain contributes its view of reality in its specific context. In the books Adapt, Survive and Flourish and Lead, Transform and Navigate, the organisation in question is the nutraceutical company NaturFlourish. These are some of those stories:
- Order tells the ordering story.
- Product tells the formulation story.
- Regulatory defines constraints on product design, manufacture and logistics.
- Marketing defines the customer lens.
- Operations defines execution of the supply chain.
These are not merged mechanically—they are stories negotiated, challenged, and aligned by the people working in Gemba, the place where customer value is created.
Business Outcomes
When done well, data modelling delivers tangible business outcomes:
- Improved decision quality
A shared understanding reduces competing interpretations and enables consistent, reliable decisions. - Reduced operational friction
Clear definitions and relationships eliminate rework, workarounds, and integration overhead. - Proactive data quality management
Issues are prevented at source rather than fixed downstream. - Stronger cross-functional alignment
Different parts of the organisation develop a shared view of reality—reducing silo-driven conflict. - Faster, more coherent execution
When meaning is aligned, systems, processes, and people operate consistently.
What makes this possible?
The real value comes from the process itself:
- It builds trust and cooperation — creating a virtuous cycle of collaboration.
- It creates shared understanding and empathy — breaking down silos.
- It connects people across domains — strengthening organisational networks.
- It establishes a shared language — forming the foundation for a coherent knowledge base and a common glossary for use by all.
4. Patterns
A simple pattern illustrates this, the progression from concept to concept.
- An Active Ingredient determines a Product Formulation, which is presented as a Product.
- A Product is made in a Product Batch, which in turn is subject to Quality Control
- A Product is purchased by Customer(s) in a Market Demographic.
Each step forces questions:
- What exactly is a “Product”?
- When does a formulation become a product?
- Who owns the definition?
- What happens when it changes?
What emerges
Through this process:
- tacit knowledge is surfaced,
- assumptions are exposed,
- conflicts are resolved,
- and meaning is stabilised.
The model is not the goal.
The shared understanding created while building it is the real outcome.
Competing Definitions
What it is
Different parts of the organisation use the same term (e.g. “customer”, “product”) with different meanings.
What it looks like
- Multiple versions of the same concept across systems
- Meetings spent aligning language instead of making decisions.
- Reports that don’t reconcile
Consequence
- Decisions are made on incompatible interpretations.
- Trust erodes between teams.
- Data quality issues become persistent and unresolvable.
Intervention
Surface and negotiate meaning explicitly through shared modelling.
Conceptual–Physical Drift
What it is
The system implementation diverges from how the business understands its world.
What it looks like
- Systems behaving “incorrectly” (from the business perspective)
- Workarounds and manual fixes
- Increasing integration complexity
Consequence
- The system no longer reflects reality.
- Operational friction increases
- Decisions are based on distorted representations.
Intervention
Continuously align conceptual models with physical implementation—test at Gemba.
Fragmented Meaning
What it is
Shared understanding never forms; each domain operates within its own interpretation.
What it looks like
- Siloed systems and processes
- Conflicting metrics and KPIs
- Local optimisation over organisational coherence
Consequence
- The organisation fragments into disconnected parts
- Integration becomes manual or impossible.
- Strategic execution slows or fails.
Intervention
Create structured socialisation opportunities to build shared meaning across domains.
5. Hidden Definition Power
What it is
Control over key definitions is implicit, unacknowledged, or contested.
What it looks like
- Certain teams dominating terminology.
- Definitions changing without visibility.
- Disputes over “what is correct”.
Consequence
- Decisions are shaped by unseen authority.
- Accountability becomes unclear.
- Bias and risk are embedded in the model.
Intervention
Make ownership of meaning explicit and visible.
6. Abstraction Risk
What it is
Simplification or omission in the model hides important real-world complexity.
What it looks like
- Edge cases ignored
- “Exceptions” managed manually
- Overly clean models that don’t reflect reality.
Consequence
- Risk becomes invisible until failure occurs.
- Systems break under real-world conditions.
- Ethical consequences emerge (who/what is excluded)
Intervention
Test abstractions against real scenarios and edge conditions at Gemba.
7. What it reveals
Data modelling exposes decisions that are often hidden:
Inclusion and exclusion
What gets modelled—and what doesn’t?
→ defines organisational focus.
Definition power
Who defines key concepts?
→ shapes decisions and outcomes
Ownership and accountability
Who is responsible for meaning?
→ determines data stewardship and trust.
Consequences of abstraction
What is simplified or ignored?
→ creates risk, sometimes invisible.
These are not technical issues.
They are ethical decisions with real consequences.
8. Data Quality Management (DQM) — a necessary extension
Traditional DQM focuses on:
- accuracy
- completeness
- consistency
These are necessary—but not sufficient.
Because quality depends on something deeper:
Is the meaning itself correct and still valid?
Data modelling and DQM are inseparable.
A data model defines:
- what “correct” means
- what “complete” includes
- what “consistent” aligns to
Without a shared model:
- DQM becomes reactive.
- fixes are local.
- inconsistencies persist.
With a shared model:
- DQM becomes proactive.
- ownership is clear.
- quality expectations are explicit.
- issues are resolved at source.
You cannot manage data quality without managing meaning.
9. How to apply (practical entry)
Keep it simple and “mind-sized”.
Step 1 — Define a tight scope.
Pick a significant business question
(e.g. “How do we define a product we can manufacture and sell?”)
Step 2 — Bring the right perspectives.
Include the domains that live the reality
(Product, Regulatory, Marketing, Operations)
Step 3 — Start with a strawman (AI can help)
Use AI as an apprentice:
- generate an initial structure.
- identify obvious entities and relationships.
🧰 From the AI/Human Business Modelling Guideline
At this point, most teams realise that even a “simple” model needs a more disciplined approach.
What you’ve seen above is a simplified entry into data modelling as a learning process.
In practice, even a “simple” model benefits from a more structured approach.
The AI/Human Business Modelling Guideline provides this in a detailed, comprehensive, and broad framework that supports:
- consistent model construction
- structured socialisation
- integration with capability models (BCM)
- alignment with data quality expectations (DQM)
- and disciplined use of AI as an apprentice modeller
At a glance, the approach looks like this:
- Frame the question clearly
Keep scope tight and grounded in a significant business problem. - Apply modelling patterns and rules
Use proven structures to guide consistency and clarity. - Generate a strawman (AI-assisted)
Use AI to explore possibilities and accelerate initial structure. - Socialise for meaning
Engage stakeholders to refine, challenge, and align perspectives. - Stabilise and publish
Agree definitions, relationships, and ownership. - Test at Gemba
Validate the model against real work, decisions, and outcomes.
The key difference
Without guidance, modelling tends to become:
- inconsistent
- overly complex
- disconnected from reality
With a structured approach:
Models become coherent, testable, and reusable — supporting both learning and decision-making.
AI as Apprentice
Within this approach, AI plays a specific role:
- generating initial structure
- exploring alternatives
- accelerating iteration
But it does not replace:
- judgement
- context
- or shared meaning
AI helps you model faster.
Only people can make the model meaningful.
A deeper capability
This Subject Area introduces the principles.
The full guideline provides:
- complete modelling patterns
- detailed rules and constraints
- worked examples (including NaturFlourish)
- integration with BCM, SECI, and DQM
- and a repeatable method for building “mind-sized” models
👉 It is designed to move from conceptual understanding to consistent practice.
Step 4 — Socialise and refine.
Run a structured conversation:
- Each domain tells its story, review and confirms it as representing reality.
- Challenge definitions, context of use and interpretations.
- Resolve conflicts.
Step 5 — Stabilise meaning.
Agree on:
- Entities and their attributes.
- The relationships between them
- Definitions as these are your common language.
Keep it simple — avoid over-modelling.
Step 6 — Link to capability (BCM)
Anchor the model to its owning business capability:
- This is where work actually happens,
- What decisions are made.
- Where consequences land.
Step 7 — Use it (this is critical)
Apply the model to:
- real decisions
- real processes
- real data issues
If it isn’t used, it will drift from reality.
10. Where it fits
Data modelling sits within multiple pathways, with different emphasis:
Executive Pathway
- ensuring systems reflect business reality.
- breaking down silos through a shared understanding of key concepts
- improving decision quality by eliminating competing interpretations
- reducing operational friction and integration risk
- enabling proactive data quality management (DQM)
Practitioner Pathway
- early engagement
- building shared language
- supporting integration and DQM
Transformation Pathway
- after capability and complexity framing
- aligns meaning across changing systems.
- exposes hidden dependencies.
Sustainable Transformation Pathway
- influenced by purpose and ethics.
- ensures meaning remains coherent over time.
- supports long-term system integrity.
11. The transition to Ethics
By this point, you will have made decisions about:
- what matters
- whose perspective counts
- what is included or excluded?
These decisions shape outcomes across the organisation.
They are not technical decisions.
They are ethical ones.
This leads directly to the next subject area:
👉 Ethics — Designing with Consequences in Mind
Closing line
A data model is not a deliverable.
It is a record of a conversation about reality—and the consequences of how that reality is defined.